Latency vs Throughput in Embedded Pipelines: How to Profile, Model, and Optimize Data Flow
Introduction
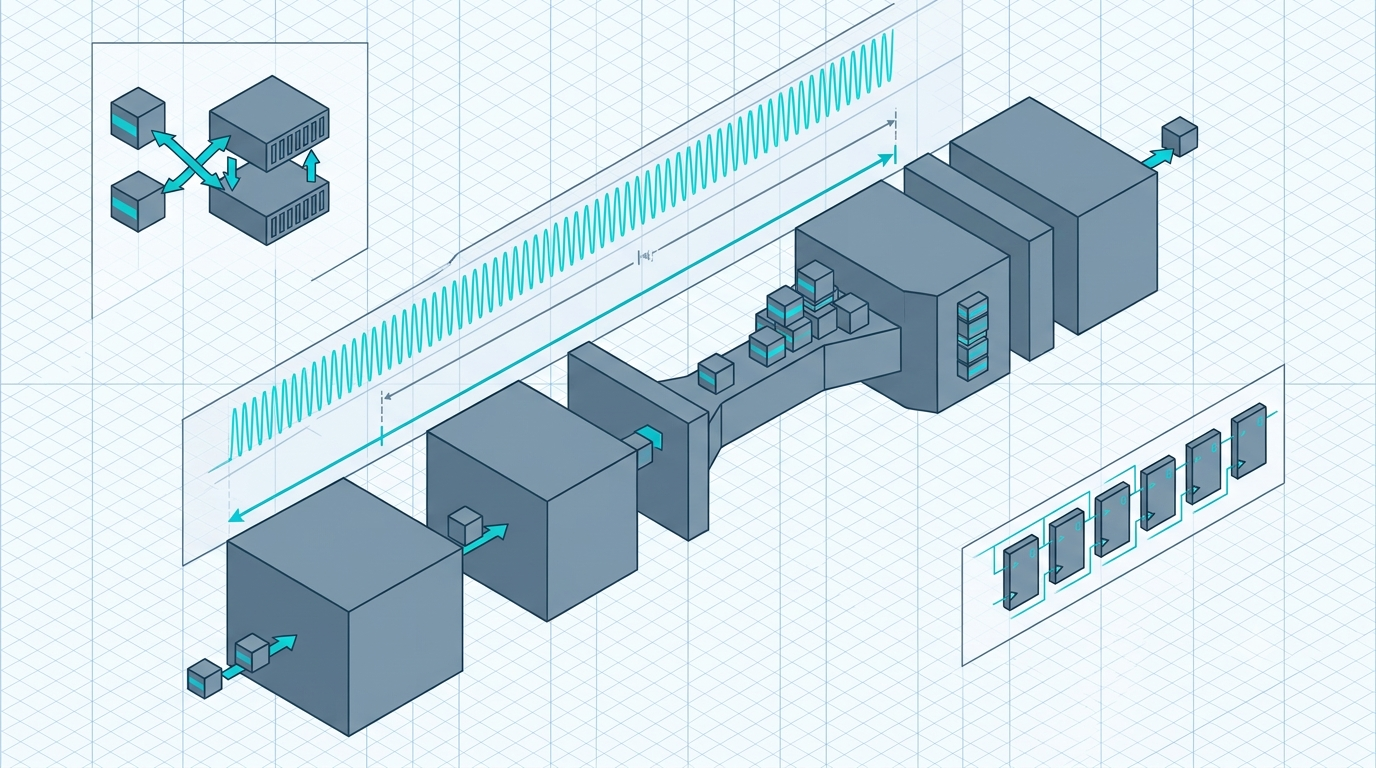
In embedded data paths — sensor acquisition chains, motor-control loops, packet processors, audio and video front-ends — two performance metrics dominate the design conversation, and they are routinely conflated. Throughput is the sustained rate at which the pipeline retires work: samples per second, frames per second, bytes per second. Latency is the time a single item spends traversing the pipeline from input to output. They are not reciprocals of each other, and a system can exhibit high throughput with high latency simultaneously.
The practical relevance is that the two targets pull design decisions in opposite directions. A control loop that must close within 50 µs has no tolerance for the deep buffering that a high-throughput logging path depends on. Engineers who optimize the wrong metric tend to discover the mismatch late, after the architecture has solidified around buffer sizes, DMA descriptor chains, or pipeline depth that are difficult to unwind. The remedy is to quantify both metrics early, attribute them to specific stages, and apply optimizations that target the metric the application actually constrains.
Defining the two metrics — and why they are not opposites
Consider a linear pipeline of n stages, where stage i has a per-item service time tᵢ.
- Unloaded latency is the sum of stage times plus inter-stage transfer:
L₀ = Σ tᵢ. - Steady-state throughput is governed by the slowest stage alone:
X = 1 / max(tᵢ).
The asymmetry is the key insight. Throughput depends only on the bottleneck stage; latency depends on all stages. Adding pipeline stages or buffering can raise throughput while leaving the bottleneck untouched, but it almost always increases latency because more items are in flight at once.
Little's Law as the modelling backbone
For any stable pipeline, Little's Law relates the three quantities directly:
N = X · W
where N is the average number of items concurrently in the system, X is throughput, and W is residence time (latency). This is not an approximation — it holds for any arrival process in steady state. Its design implication is concrete: to raise throughput without reducing per-stage latency, you must increase N, i.e. allow more items in flight via deeper queues or more parallel stages. That added concurrency is exactly what inflates W. Conversely, a latency-bound design wants N as small as possible — ideally one item in flight — which caps achievable throughput at 1 / L₀.
A bottleneck model plus Little's Law is usually enough to predict whether a proposed change helps the metric you care about before any code is written.
Profiling: where and how to measure
Modelling tells you where to look; profiling tells you the real numbers, including the ones the model omits — cache misses, bus contention, interrupt jitter, and worst-case rather than average behaviour.
Practical instrumentation, from least to most intrusive:
- GPIO toggling + logic analyzer / oscilloscope. Set a pin high on stage entry, low on exit. Sub-cycle resolution, near-zero overhead, and it captures the real silicon, not a simulation. The standard first move for latency and jitter.
- Cycle counters. On Cortex-M, the DWT (Data Watchpoint and Trace)
CYCCNTregister gives cycle-accurate stage timing with a handful of instructions of overhead. - Trace infrastructure. ITM/SWO for low-rate event markers, ETM for full instruction trace. RTOS-aware tools (Percepio Tracealyzer, SEGGER SystemView) reconstruct task scheduling, queue depths, and blocking time — essential when latency is dominated by waiting, not computing.
- FPGA fabric instrumentation. Integrated Logic Analyzers (Xilinx ILA / Intel SignalTap) and free-running counters measure initiation interval and stage occupancy on-chip at clock resolution.
// Cortex-M cycle-accurate stage timing (DWT CYCCNT)
CoreDebug->DEMCR |= CoreDebug_DEMCR_TRCENA_Msk; // enable trace subsystem
DWT->CYCCNT  = 0;                               // reset counter
DWT->CTRL   |= DWT_CTRL_CYCCNTENA_Msk;          // start counting CPU cycles

uint32_t t0 = DWT->CYCCNT;
process_stage();                                // code under measurement
uint32_t cycles = DWT->CYCCNT - t0;             // unsigned subtract wraps cleanly mod 2^32
Two discipline points: measure steady state separately from transients (cold-cache first iterations distort averages), and record worst-case, not just mean. A control or safety path is specified by its Worst-Case Execution Time (WCET) and jitter, not by its average latency.
Where to optimize when throughput is the target
When the constraint is sustained data rate, the only stage that matters is the bottleneck — X = 1 / max(tᵢ). Effort spent anywhere else is wasted until that stage is widened.
- Identify and attack the bottleneck stage. Speeding up a non-bottleneck stage changes nothing. Re-profile after every change because the bottleneck moves.
- Overlap I/O with compute via double (ping-pong) buffering. The CPU processes one buffer while DMA (Direct Memory Access) fills the other, decoupling acquisition rate from processing rate.
- Amortize fixed overhead with batching and burst transfers. Larger DMA bursts and scatter-gather descriptor chains spread per-transaction setup cost across more payload.
- Widen the datapath. SIMD (Single Instruction, Multiple Data) instructions on a DSP or Cortex-M with Helium/NEON, or wider buses, raise items-per-cycle.
- Add pipeline stages / parallel lanes. More concurrency (larger N) lifts the throughput ceiling per Little's Law.
// Ping-pong DMA: overlap acquisition with processing to raise throughput.
// Costs exactly one buffer-period of added latency.
static uint16_t buf[2][BLOCK_LEN];
volatile int8_t  half_ready = -1;

void DMA_HalfXfer_IRQHandler(void) { half_ready = 0; } // first half filled
void DMA_FullXfer_IRQHandler(void) { half_ready = 1; } // second half filled

for (;;) {
    if (half_ready >= 0) {
        process_block(buf[half_ready], BLOCK_LEN); // runs while DMA fills the other half
        half_ready = -1;
    }
}
On FPGA, the analogue is the Initiation Interval (II) — the number of clock cycles between accepting consecutive inputs. II = 1 means one item per cycle, so throughput equals the clock frequency regardless of how deep the pipeline is.
// Vitis HLS: II=1 accepts a new sample every clock; throughput = f_clk.
// Pipeline latency = depth in cycles, independent of throughput.
void fir(const sample_t x[N], sample_t y[N]) {
    for (int i = 0; i < N; i++) {
#pragma HLS PIPELINE II=1        // start a new iteration each clock cycle
        acc_t acc = 0;
        for (int k = 0; k < TAPS; k++) {
#pragma HLS UNROLL               // parallelize MACs so II=1 is schedulable
            acc += coeff[k] * shift[k];
        }
        y[i] = acc >> SHIFT;
    }
}
Where to optimize when latency is the target
A latency-bound design wants the opposite moves: fewer items in flight, shorter paths, deterministic timing.
- Shorten the path. Remove or fuse stages; every stage adds to
Σ tᵢ. - Shrink queue depth toward one. Deep FIFOs buy throughput headroom but add residence time. Latency-critical paths use minimal buffering, accepting the risk of stall under burst load.
- Process per-item, not per-batch. Batching is the enemy of latency: waiting to fill a block delays the first item by the whole fill time.
- Prefer cut-through over store-and-forward. Begin forwarding as soon as the header / first words arrive instead of buffering the whole frame.
- Make timing deterministic. Pin hot code and data to Tightly-Coupled Memory (TCM), lock critical lines in cache, and minimize the interrupt-service-routine (ISR) path. Eliminating cache and jitter variance often matters more than reducing the mean.
- Use preemption deliberately. A high-priority task or hardware interrupt can bypass queued background work — at the cost of throughput for that background work.
Architecture-specific notes
| Architecture | Throughput lever | Latency lever |
|---|---|---|
| MCU, bare-metal | DMA bursts, ping-pong buffers, SIMD | Short ISR path, TCM placement, no batching |
| MCU + RTOS | Larger message queues, batched task wake-ups | Priority preemption, small queues, priority-inheritance mutexes to bound blocking |
| FPGA / HLS | II=1, unrolling, parallel lanes |
Fewer pipeline registers, lower depth, cut-through dataflow |
| DSP | SIMD MACs, circular buffers, software pipelining | Single-sample processing, deterministic memory access |
| Multicore SoC | Pipeline stages across cores, parallel partitions | Cache-coherency cost and inter-core sync dominate — co-locate latency-critical stages on one core |
The recurring pattern: each architecture offers a concurrency mechanism that buys throughput (larger N) and a determinism / short-path mechanism that buys latency (smaller N). They are the same dial turned in opposite directions.
Trade-off summary
| Technique | Primary effect | Cost |
|---|---|---|
| Deeper pipelining | ↑ throughput | ↑ latency (more items in flight) |
| Larger DMA bursts / batching | ↑ throughput (amortized overhead) | ↑ latency (wait to fill batch) |
| Double / ping-pong buffering | ↑ throughput (overlap I/O + compute) | ↑ latency (one buffer-period) |
| SIMD / wider datapath | ↑ throughput | minor area / power cost |
| Smaller queue depth | ↓ latency | ↓ throughput headroom, stall risk |
| Cut-through forwarding | ↓ latency | weaker integrity checking |
| Priority preemption | ↓ latency on critical path | ↓ background throughput |
| TCM / cache locking | ↓ and deterministic latency | scarce fast memory |
Conclusion
Latency and throughput are independent metrics linked by Little's Law (N = X · W) and constrained by bottleneck analysis (X = 1 / max tᵢ, L₀ = Σ tᵢ). The decisive engineering act is to identify which one the application actually constrains, because nearly every optimization trades one for the other: concurrency and buffering raise throughput and inflate latency, while short paths and shallow queues cut latency and cap throughput.
The recommended workflow is to model with the bottleneck / Little's Law relations first, then profile with cycle-accurate or pin-level instrumentation to capture worst-case and jitter — not just averages — and only then apply the directionally correct optimization, re-profiling after each change because the bottleneck migrates.
Throughput-oriented techniques (batching, deep pipelines, ping-pong DMA) are appropriate for streaming, logging, and bulk-transfer paths where end-to-end delay is uncritical. Latency-oriented techniques (per-item processing, minimal buffering, preemption, deterministic memory) are appropriate for control loops, protocol responders, and safety paths. They are rarely appropriate together in the same path; when an application needs both, the correct structure is usually two separate paths — a low-latency fast path beside a high-throughput bulk path — rather than a single compromise pipeline.
References / Further Reading
- Little, J. D. C. (1961). A Proof for the Queuing Formula: L = λW. Operations Research, 9(3), 383–387.
- ARM Ltd. (2023). Armv7-M Architecture Reference Manual (DWT and DebugMonitor sections). ARM DDI 0403.
- AMD/Xilinx. (2023). Vitis High-Level Synthesis User Guide (UG1399), Pipelining and Dataflow Optimization chapters.
- Hennessy, J. L., & Patterson, D. A. (2017). Computer Architecture: A Quantitative Approach (6th ed.), Ch. 4 (pipelining) and Appendix C. Morgan Kaufmann.
